VolDynamics · Volume & Order Flow Lens

See where participation really shows.

Price moves on air all the time. VolDynamics is a state indicator, not a trade signal. It colors the candle when volume crosses your threshold: green when buyers push, red when sellers do. Real participation is obvious at a glance.

Walter, founder of Flow.42

Price can move on air. VolDynamics shows me when the participation behind it is actually real. Walter, founder of Flow.42

NinjaTrader 8 Futures · FX · Crypto Tick data required

A clearer read on real participation.

I built VolDynamics to answer one question on every bar: is anyone actually behind this move? It reads volume and order flow and paints it on the candle: green when buyers push, red when sellers do, or a Heatmap that shades every bar by intensity. Where price goes next is your call. What it shows is whether the move has real participation behind it.

Is anyone behind the move?

VolDynamics is a state, not a trade signal. When volume crosses the threshold, it colors the candle by who's pushing: green for buyers, red for sellers. At a glance you see whether there's a real push behind the move, or not.

Volume Push

Volume clears the line and one side is pushing. The candle lights up: green up, red down. Real participation behind this bar.

No push

Volume is ordinary, or showing up late. The candle stays quiet. Nothing behind this move worth chasing.

Trading Involves Risk. Flow42 Trading Software is built to reduce unnecessary exposure and support disciplined decisions.

See the push instantly

When a bar's volume crosses the threshold, the candle lights up, so a real Volume Push is obvious at a glance.

Skip the empty moves

No color means no real participation: one loud candle nobody followed. You see that just as clearly.

Context in one layer

Volume and order flow, read together on the candle instead of squinting at a separate panel.

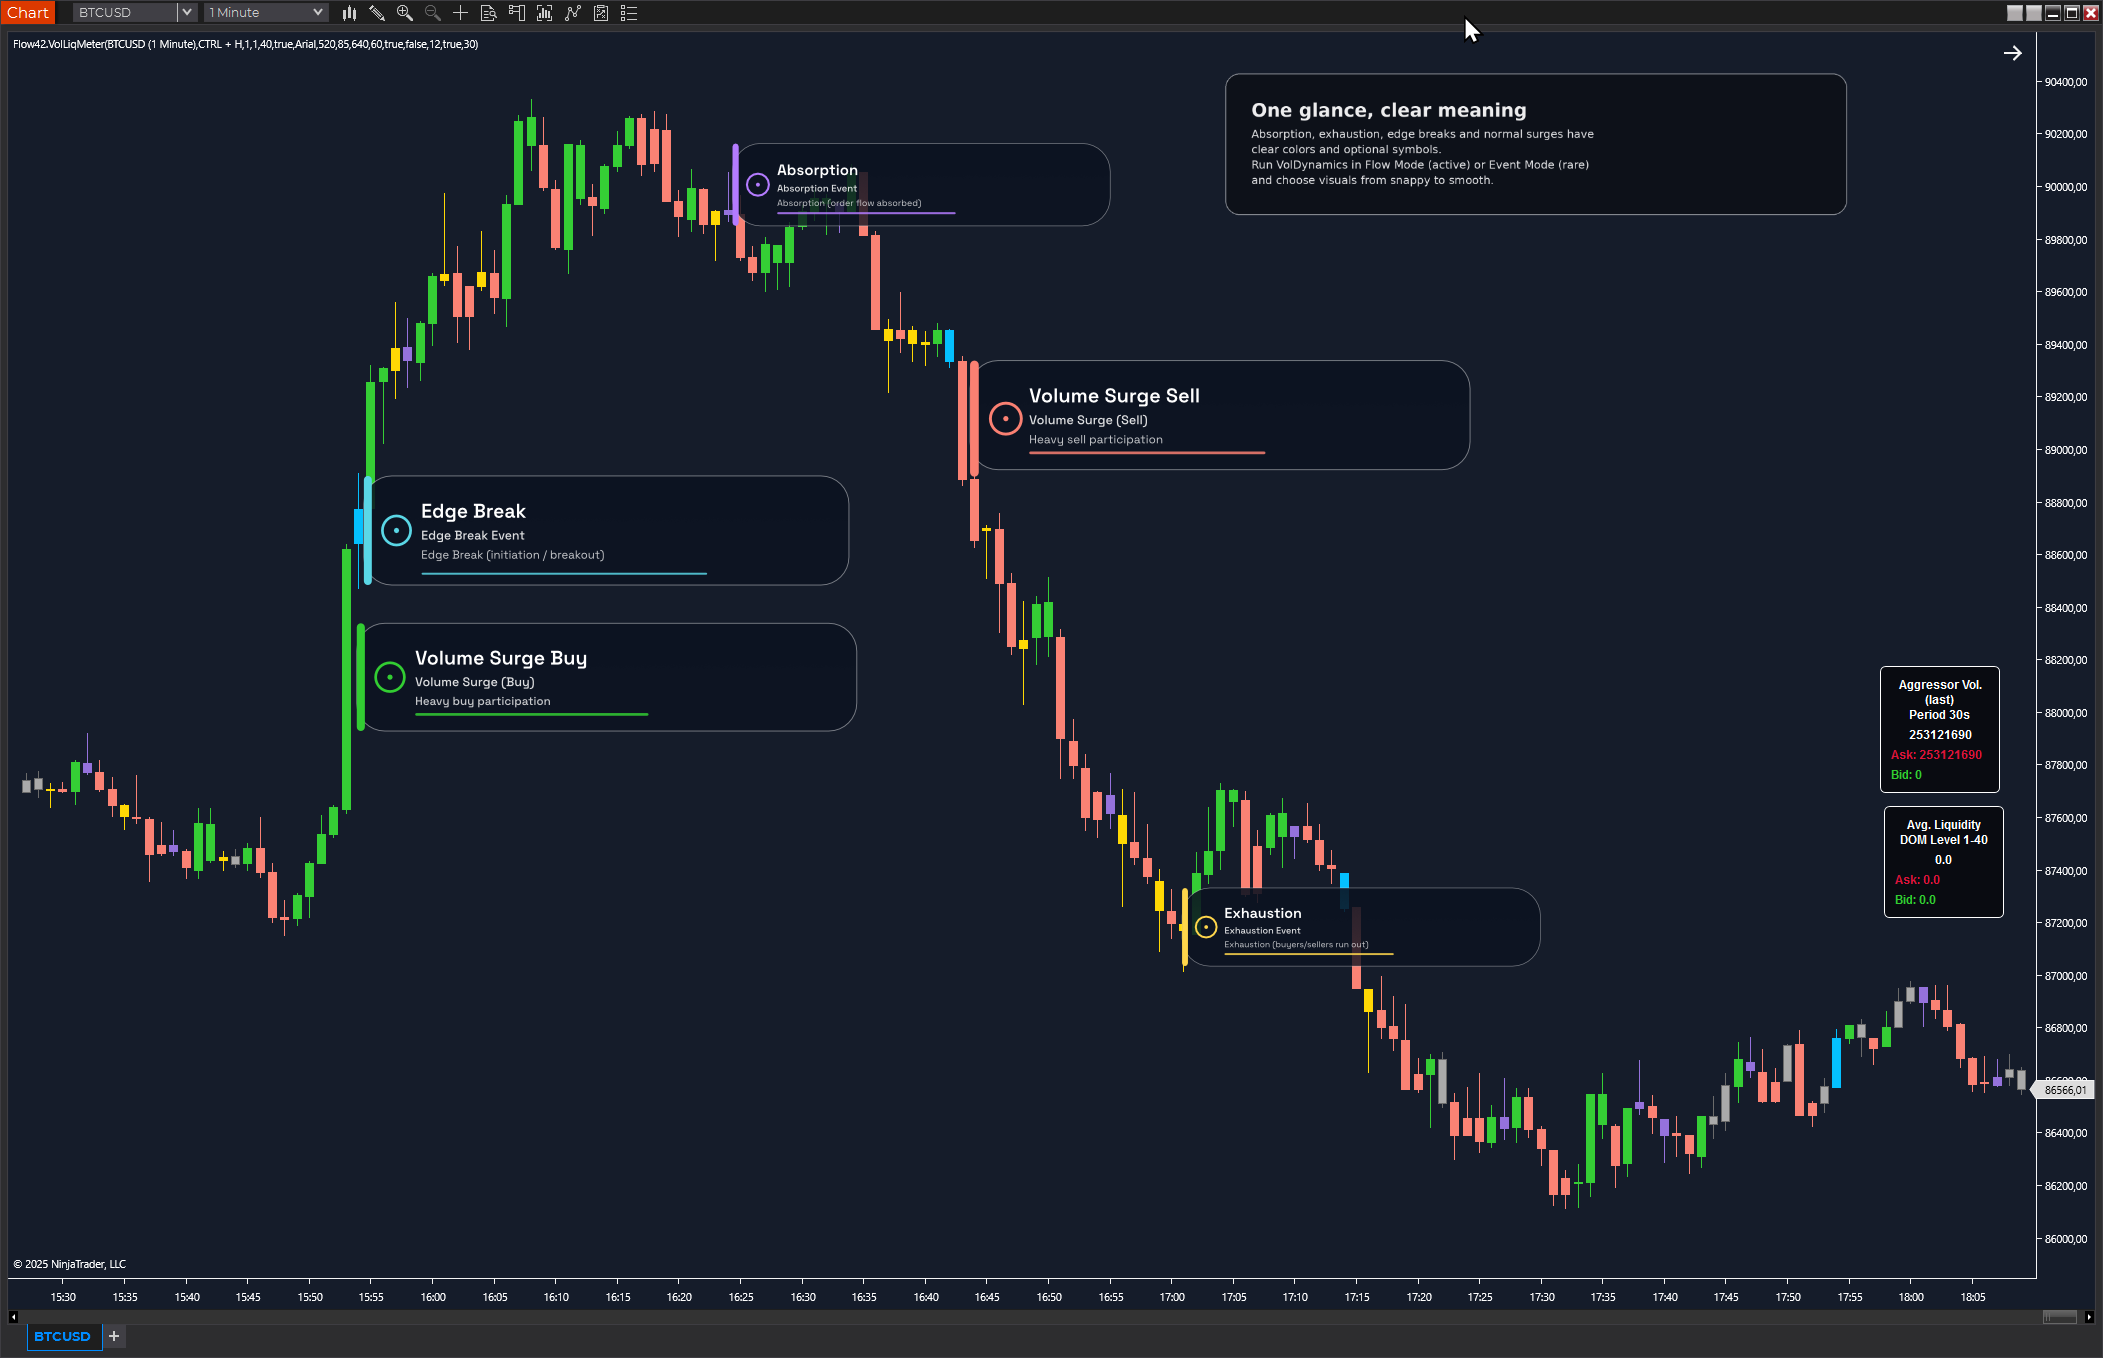
One glance, clear meaning

When a bar crosses the volume threshold it lights up, green for buyers and red for sellers, with an optional symbol and hover labels for the detail. Pick how you see it: Spike bars color just the surges, or Heatmap shades every bar by volume intensity.

A threshold you set, or one that self-tunes

Set a fixed volume line that counts as a real push. Simple and predictable. Or switch on the adaptive baseline that learns each time-of-day's normal volume, with Autopilot tuning the surge level to current volatility. Your call: a line you set, or one that self-adjusts.

Push confirmed by the tape

The push can be filtered or confirmed against order flow metrics: buy vs sell volume, aggression ratios, progress per 1k contracts. That's how you tell a dramatic-looking candle from one that actually had real participation behind it, so the color only lights up when there's genuine push, not just a big print.

VOLDYNAMICS FAQ

Push, or just noise?

A few straight answers on how VolDynamics reads volume events, and where it fits into the way you trade.

A standard volume or delta panel tells you how much traded. VolDynamics tells you whether it mattered by coloring the bar the moment volume crosses your threshold, green for buyers and red for sellers, right on the chart. Instead of staring at raw numbers, you get one clear state per bar you can review in your playbook.

VolDynamics runs in both UpDownTick and BidAsk mode. With full bid/ask data you get a more precise view of aggression, but even in UpDownTick mode the core push logic still works. The important part is that price, volume and order flow are evaluated together, so even a simpler feed can give you a useful signal set.

No. VolDynamics is a state indicator, not a trade signal. It doesn't tell you to buy or sell, and it won't call direction. It colors the bar when a real Volume Push shows up, so you can see whether there's genuine participation behind a move, and bring that context to your own setups, whatever your style.

Under the hood there’s a lot going on, but the goal on the screen is simplicity. You can start with the default presets and just learn what each color and marker means. When you’re ready, the documentation walks you through each parameter step by step, so you can tune sensitivity and strictness without breaking the core logic.

Walter, founder of Flow.42

The Flow.42 way

Trade less. Trade better. Trade with clarity.

Momentum lies more often than people think. I want to see when it's real, not just loud.

Walter · Flow.42 Analytics